A Rudimentary Senate Election Model Based off of ORACLE
ORACLE is built to create predictions for the House of Representatives. ORACLE looks at individual districts to do so, such an approach cannot be done when making a Senate model as Senators are voted upon by a State as a whole. Luckily, the Federal Election Commission (FEC) provides, for each state, holistic general election results. Therefore, they publish the number of votes cast statewide for Republican or Democratic candidates for the House even though the candidates are voted upon by only a single district. They also publish Senate election results. By observing the relationship between the two-party vote percentage cast statewide for the House and the two-party vote percentage cast for the Senate, we can create a model for the Senate Elections based off of ORACLE.
Derivation of the Model
First, this is essentially another methodology page and it uses the same conventions as the About page. There are three sets of raw data that goes into this model: statewide vote counts for both the House and Senate, and incumbency of running senatorial candidates. Similar to ORACLE, collected election data only go as far back as the 2012 general election, and unopposed races for either House or Senate do not count in calculations in the derivation. Furthermore, I treated the non-elected Senate appointees running as incumbents and Independent candidates as Democrats as both current Independent Senators caucus with the Democrats. The statewide vote percentages are calculated in the same way that they are for district wide vote percentages for ORACLE. Once I had the Democratic statewide vote percentages for both the House and the Senate, I plotted the Senate vote percentages against the House vote percentages to try and find a relation between the two.

Figure 1 displays the Senate Democratic Vote % against the House Democratic Vote %. The black line that is overlaid over the points is the line of best fit. The equation for the line is \(\text{Senate}\% = 7.907\% + 0.8656 \text{House}\%\). This means that if state A casts \(10\%\) more of their votes for the Democratic House candidates than another state B, then state A will predictedly cast \(8.6\%\) more of their votes for the Democratic senatorial candidate than state B. Further, it also says that if no Democratic votes were cast on House candidates in a state, then predictedly \(7.9\%\) of the vote will still be cast on the Democratic senatorial candidate. This regression, which resulted in the equation relating Senate Democratic vote percentage and House Democratic vote percentage, gives an \(R^2\) of \(70.1\%\). This means that \(70.1\%\) of the difference between states’ Senate Democratic vote percentages can be explained by the difference between states’ House Democratic vote percentages.
Another important variable for predicting races is what I like to call the “If it ain’t broke” factor, or incumbency. Inputting incumbency to the regression leads to an \(R^2\) of \(80.4\%\). This means that \(80.4\%\) of the difference between states’ Senate Democratic vote percentages can be explained by the difference between states’ House Democratic vote percentages and differences in which party holds the incumbency. Figure 2 provides us with new weights to calculate a state’s predicted Senate Democratic vote percentage from House Democratic vote percentages and incumbency.
Base Number | 17.25% + 0.6553 House% |
Democratic Incumbent Weight | 6.35% |
Republican Incumbent Weight | 5.34% |
Figure 2. Regression with House%, and incumbency weights
In order to get our Senate Democratic vote percentage, we begin by calculating the base number, inputting the House Democratic vote percentage to \(\text{House}\%\). Then if there is a Democratic incumbent we add \(6.35\%\), and if there is a Republican Incumbent, then we subtract \(5.34\%\). To visualize the creation of this model, it basically splits up the datapoints of Figure 1 into three groups based on incumbency and fits three parallel lines, one for each group, as shown in Figure 3.
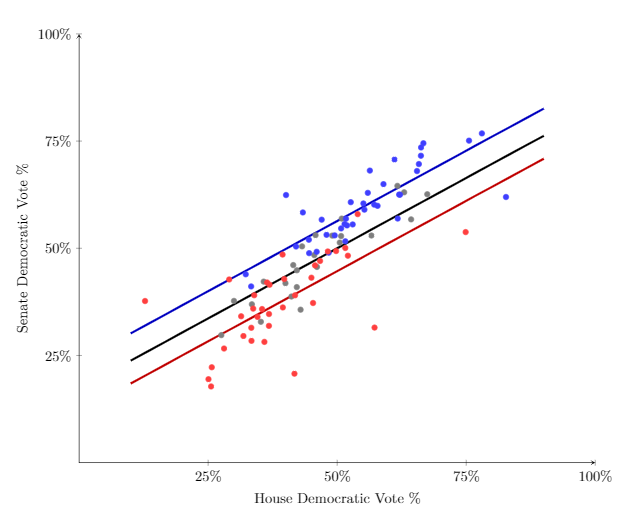
The points on Figure 3 are at the same places as in Figure 2, however they are colored. The blue dots represent past elections in which a Democratic incumbent ran. The red dots represent past elections in which a Republican incumbent ran, and the grey dots represent past elections when no incumbent ran. The three different lines represent the regression that we should be using depending on the incumbent running. So the blue line represents the predicted relationship between House Democratic vote percentage and Senate Democratic vote percentage when there is a Democratic incumbent, the red line is for when there is a Republican incumbent, and lastly the black line is for when there is no incumbent running.
Methodology
The next step is applying this regression from the results spouted out by the ORACLE. The regression’s inputs are incumbency, which is determined and fixed, and statewide House Democratic vote percentage, which is yet undecided. However, the AUSPICE that the ORACLE gives provides individual districts’ predicted Democratic vote percentages and standard deviations. We can aggregate individual district-wide predicted Democratic vote percentages to create a statewide predicted Democratic vote percentages by simply taking an average of the predicted Democratic vote percentages of each district for each state. This aggregation assumes that the population of districts are equal, and they are roughly equal. To aggregate the standard deviations, we assume that the district election results are independent of each other, and we aggregate them.
Suppose that a state has \(k\) districts, the predicted Democratic vote percentage of district \(i\) and standard deviation of the prediction are \(\mu_i\) and \(\sigma_i\), respectively. The predicted statewide Democratic vote percentage would be \(\mu = \frac{1}{k} \sum \limits_{i=1}^{k} \mu_i\) with standard deviation \(\sigma = \frac{1}{k} \sqrt{\sum \limits_{i=1}^{k} \sigma^{2}_i}\). Much like in ORACLE, I added a 1.38% noise to the standard deviation. Then we take these values and input them into our regression. Which gives us a predicted Senate Democratic vote percentage of \(17.25\% + 0.6553\mu + 6.35\% \text{Dem Incumbent} - 5.34\% \text{Rep Incumbent}\) with standard deviation \(0.6553 \sigma + 1.38%\) . From here on, we can treat these like we do AUSPICE numbers to create a national prediction as outlined in polistat.mbhs.edu/about.
Results
Figure 4. Statewide Senate Predictions
When I simulated the national election 1,000,000,000 times, here is the histogram produced for the make up of next year's Senate:

Figure 5. National Senate Model Prediction
This model predicts that there is 97.8% chance that the Republicans will keep control over the Senate. There are several races that this model disagrees with expectation.
Discussion
One type of discrepancy is races when an appointed Senator is running. This model considers such candidates to be incumbents, which gives them an incumbent advantage but they have not been a Senator for as long as the other candidates. Another set of discrepancies are races that are considered close: Typically the model predicts an expectedly close race to be too certain of a win for a candidate. Most notably, these races are in Florida, Missouri, and in Nevada. In the case of Florida, it is typically thought of as a split state, however, this year the Democrats are predictedly winning more easily than the Republicans. ORACLE predicts that the average Democratic vote percentage in the districts Democrats are predictedly winning in Florida is 75%, whereas the average Republican vote percentage in the districts Republicans are predictedly winning in Florida is 58%. This Democratic dominance in their districts is potentially explained by the national mood shift. Considering that of the 27 districts in Florida, predictedly 13 are voting Democrat, this leads to a high predicted statewide Democratic vote percentage which is reflected by our Florida prediction in this model.
The other two states that this model seems too certain about the winner are Missouri and Nevada. The cause for this is that the incumbency advantages simply skew the model too much. To put that into perspective, for a Democratic incumbent to predictedly lose, the statewide vote percentage must be less than 40%. Every percentage point beyond that increases the margin by \(0.6553\% \times 2 = 1.316\%\). Each percentage point matters a lot, as can be seen in the difference between the Arizona race and the Missouri race: A difference of about 1.5% in predicted vote percentage leads to a difference of 16% in the chance predicted that the winner will win. However, this incumbent advantage can be overcome as can be seen in North Dakota, where Heidi Heitkamp is predicted by the model to lose.
Sources
"List of United States Senators from West Virginia. " Wikipedia, Wikimedia Foundation, 11 Feb. 2018, en.wikipedia.org/wiki/List_of_Unidted_States_Senators_from_West_Virginia. Accessed 31 Oct. 2018
Bycoffe. "Tracking Congress In The Age Of Trump." FiveThirtyEight, 10 Oct. 2018, projects.fivethirtyeight.com/congress-trump-score/. Accessed 31 Oct 2018.
West Virginia Election Results 2016. www.nytimes.com/elections/2016/results/west-virginia.
~B. L. Air Bash