Both ORACLE and FiveThirtyEight predict a similar chance for the Democrats to take over the House. But beyond that, what are the differences between the models’ predictions?
We sampled predictions from ORACLE and FiveThirtyEight’s Classic Model for October 30th, 2018. Further, we normalized FiveThirtyEight vote shares to only include the Republican and Democrat candidates so that it would be comparable to ORACLE’s model. Below are the twenty districts with the greatest vote share differences between forecasts.
|
CA-05: |
0.222626 |
|
CA-32: |
0.146246 |
|
CA-19: |
0.106554 |
|
OH-07: |
0.066015 |
|
KS-04: |
0.063636 |
|
WV-01: |
0.062063 |
|
IL-08: |
0.061607 |
|
VA-09: |
0.060538 |
|
IL-17: |
0.059798 |
|
IN-09: |
0.058255 |
|
CO-02: |
0.057170 |
|
IN-03: |
0.056988 |
|
MA-06: |
0.056951 |
|
IN-01: |
0.056602 |
|
MA-02: |
0.054880 |
|
CA-52: |
0.054259 |
|
IL-10: |
0.053880 |
|
GA-02: |
0.053605 |
|
PA-11: |
0.053488 |
|
CO-04: |
0.053068 |
Before anything else, we must filter anomalies in the data. FiveThirtyEight’s CA-05 forecast is incorrect; their raw CSV file predicts a vote share of 0.9998 for the Democrat, but the site shows .804. Additionally, certain districts have multiple candidates for a party running, most notably LA-01. We won’t consider these districts in the rest of our analysis.
Let’s first examine the distribution of vote share differences. Negative differences indicate that ORACLE predicts a higher vote share for Democrats, and vice versa.
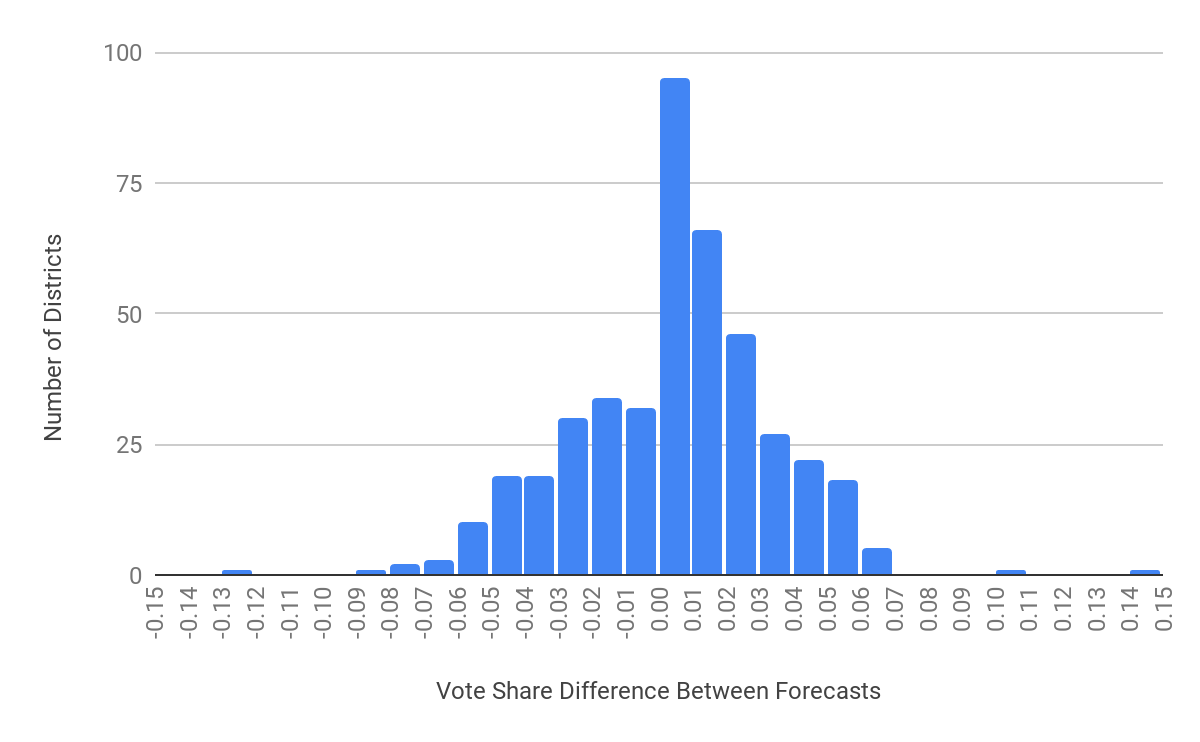
As expected, the differences are centered around zero. The data are slightly skewed left; this implies that ORACLE is more variable than FiveThirtyEight when it predicts a lower vote share for Democrats. Beyond that, the other distinct feature is the spike in values at zero; this can be explained by the districts with a single candidate. Since they are not facing any challengers, both ORACLE and FiveThirtyEight can give a 1.0 vote share.
Next, let’s examine possible explanations for these vote share differences. Although FiveThirtyEight does not publish their model’s source code, they undoubtedly incorporate polling in their model. ORACLE’s model assigns more weight polling to districts with more polls; this also appears to be a part of FiveThirtyEight’s. This motivates us to examine how the number of polls in a district affects its difference in predictions. Each point represents a district.
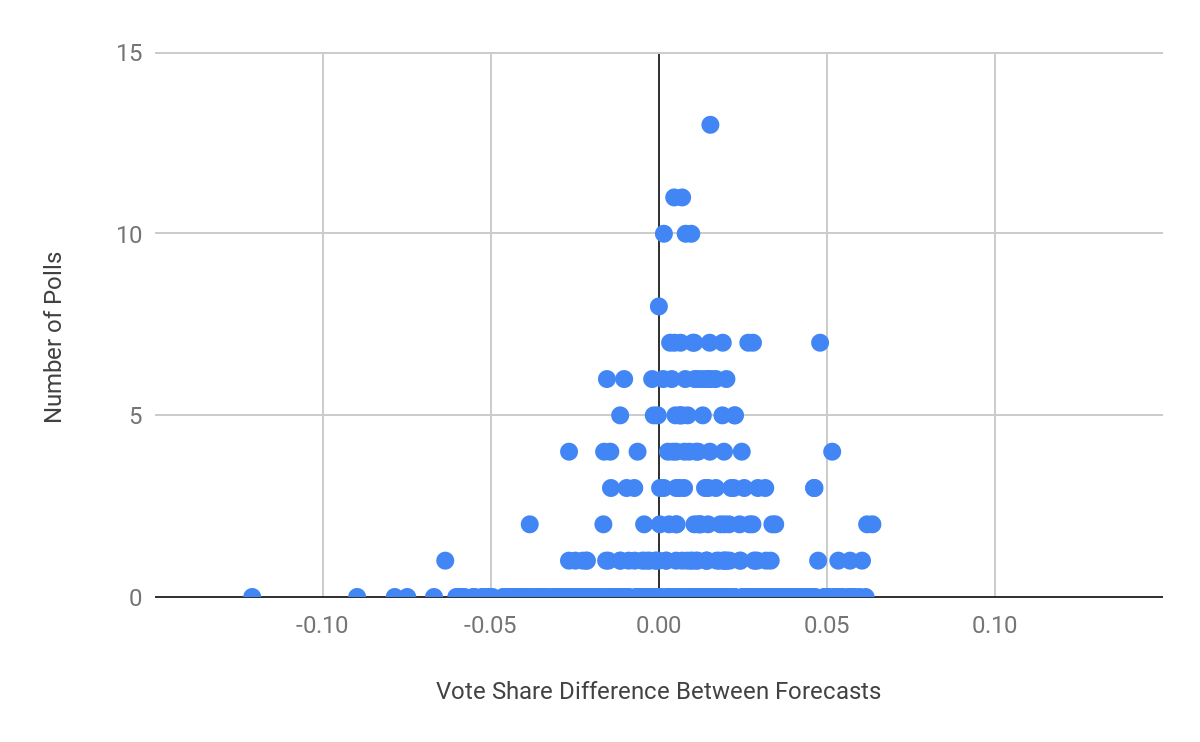
There is definitely a correlation between number of polls and variance in vote share differences. The more polls used for a district, the closer the two models' predictions are. It is worth noting that ORACLE and FiveThirtyEight use the exact same polls. Although we have less data points at higher values, they visibly cluster closer to zero. So what does this mean? The other aspects of the models — prior elections, district fundamentals, etc. — seem to be more variable. As polling gains greater weight (more polls), the models’ overall predictions become more similar.