The ORACLE of Blair uses demographics, national mood, and polling data to calculate the probability of victory for each district’s candidates. Many expert opinions in politics rely primarily on anecdotal evidence from many years of election experience, as opposed to quantitative analysis. Therefore, our predictions differ significantly in several swing districts.
In California, 53 House seats are up for grabs, making it an important state to watch. We’ve isolated six districts where our predictions differ from those of experts at Cook’s Political Ratings, Gonzales’ Inside Elections, and Sabato’s Crystal Ball: CA-10, CA-21, CA-25, CA-39, CA-45, and CA-48.
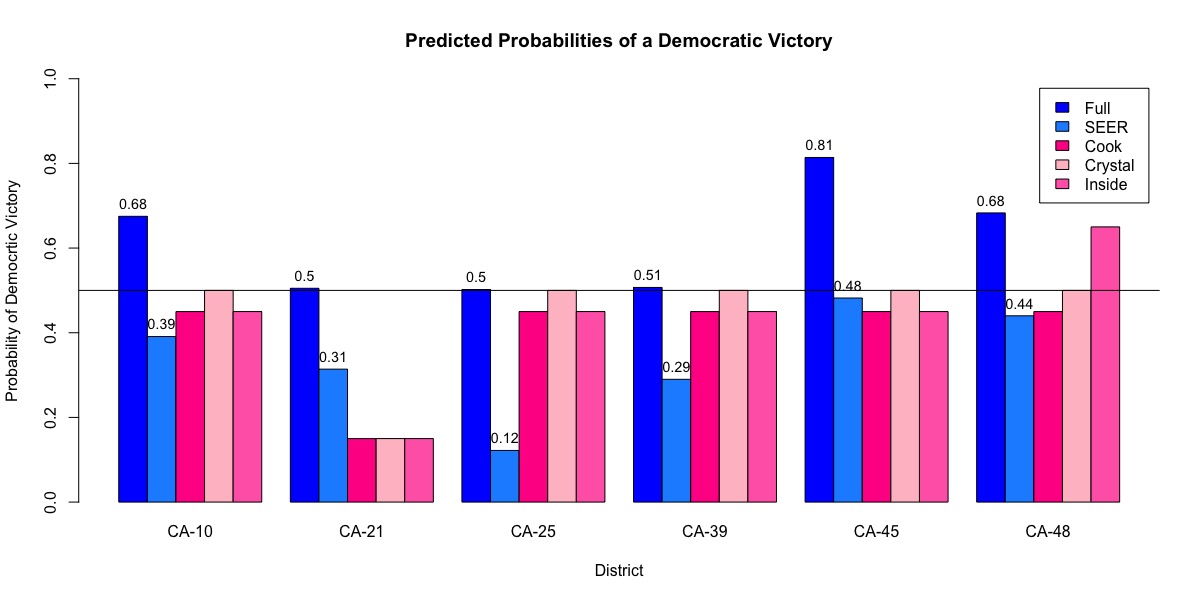
Figure 1: Barplot of the predicted probabilities of a democratic victory. Our full model and SEER-only predictions are shown in shades of blue, while the expert ratings are shown in shades of pink. Since the expert ratings were qualitative rather than quantitative, we translated them to quantitative percentages at our discretion. Toss-ups were denoted as 50%. Toss ups with a party lean were denoted as 50±5%, depending on the party. Tilts were denoted as 50±15%, depending on the party. Leans were denoted as 50±25%, depending on the party. Likelys were denoted as 50±35%, depending on the party. Solids were denoted as 50±45%, depending on the party.
In California, we are consistently calling toss-ups lean Democratic or even likely Democratic when experts are calling them as lean or likely Republican. Turnout, poll weighting and elasticity are the reasons that may cause our predictions to swing left, when expert opinions don’t:
Turnout: We based our turnout on the 2014 midterms turnout. We used this to help determine the standard deviation of the SEER component of our model before adding polls, which significantly affects our predicted chance of victory. This would likely not be as great an issue were this a presidential election. However, with midterm turnout, national mood likely won’t have so great an effect as to shift an election by 7% with no consideration for any priors or polling. A more effective way of calculating turnout may have been to look at trends between past presidential and midterm elections in the district. We applied this new methodology to CA-45 and calculated a predicted turnout of 212,278 in district with 609,544 eligible voters or 34.8%. This would increase the overall standard deviation of the national mood shift.
Votes Cast in California Toss-Up Districts in 2014 vs 2016
District | 2014 | 2016 |
CA-10 | 125,705 | 241,141 |
CA-21 | 79,377 | 132,408 |
CA-25 | 113,1721 | 261,161 |
CA-39 | 133,225 | 263,456 |
CA-45 | 162,902 | 311,404 |
CA-48 | 174,795 | 306,416 |
Figure 2. Votes cast in California’s toss-up districts in 2014 and 2016. All districts saw a significant increase in the number of votes cast between 2014 and 2016, demonstrating that the 2018 turnout is unpredictable.
Poll weighting: The difference between our predictions and those of the experts may also be associated with how much less experts weigh the polls when drawing conclusions. The polls were weighted against the fundamentals as follows:
wpolls =1.9arctan(6.12GPS),
where GPS is the grade point sum of the polls (See Methodology). If multiple polls were available, then they were weighted significantly higher than the fundamentals. For example, in CA-45, we had one B grade 12 day old poll and one A grade 35 day old poll. Therefore, GPS = 0.284 and wpolls = 0.634. Knowing the fundamentals of each district, the weight of the polls in the expert minds is likely affected by confirmation bias, where they downplay polls, evidence that contradicts their preconceived fundamentals. Comparing the expert predictions to our SEER model (fundamentals only), we see that some of the predictions are far closer to those of the experts (Figure 1). These similarities point to the experts relying heavily on the fundamentals rather than polls. That said, our fundamental methodology does not account for factors like fundraising and the incumbents voting record in congress, which experts may be taking into account. This may also account for the difference in the SEER predictions and those of the experts in some races. For instance, consider CA-45. When we only considered the fundamentals, we gave the Democratic candidate a 48.2% of winning, which is comparable to the ratings by experts of toss up Republican. After taking into account the polls, which account for 64.4% of the final prediction, our final prediction shifted heavily in favor of the Democratic candidate to result in a 81.4% of a Democratic win.
Elasticity: The bigmood shift is already making races closer that, according to all the district information we have, seem to be likely Republican. Bigmood should have a distinct effect on each districts, as some are party strongholds, whereas districts like CA-26 have oscillated between parties. We tried to compensate for this with elasticity. This is a nonpartisan value obtained from 538, which gives the amount that a district may swing, based on historical data. We used this to determine how much to shift each district by. This may be causing out model to overweigh the national mood in districts that don’t have a very long history with one party.
Our final predictions for the election outcomes of these California battleground districts favor the Democratic candidate over the Republican, while our SEER predictions, which are based on only fundamentals, are more similar to non-probabilistic models of experts, thus explaining the differences between our models.